Updated April 2026
How Seismic Data Drives Oil & Gas Exploration — From 2D to 4D
In the oil and gas industry, making informed decisions about where to drill — and how to develop what you find — requires precise, reliable information about what lies beneath the surface. Seismic data is the primary tool for generating that information. It helps geophysicists and engineers identify potential reservoirs, evaluate geological risk, and optimize exploration and development programs before the first bit of drill pipe turns.
At Silverthorne Seismic, our team has worked with seismic data across virtually every phase of its lifecycle — from survey design and acquisition through processing, brokerage, and formation evaluation. What follows reflects both industry fundamentals and the practical realities our geoscientists navigate on active projects.
What is Seismic Data?
Seismic data is subsurface information captured by sending acoustic energy into the earth and recording the reflected waves at the surface. On land, the energy source is typically a vibroseis truck — a heavy vehicle that applies a vibrating base plate to the ground, generating controlled sound waves across a specific frequency range. Those waves travel downward through the earth, reflecting off rock layer boundaries as they encounter changes in density and elasticity. The reflected energy returns to the surface, where it is captured by sensors called geophones.
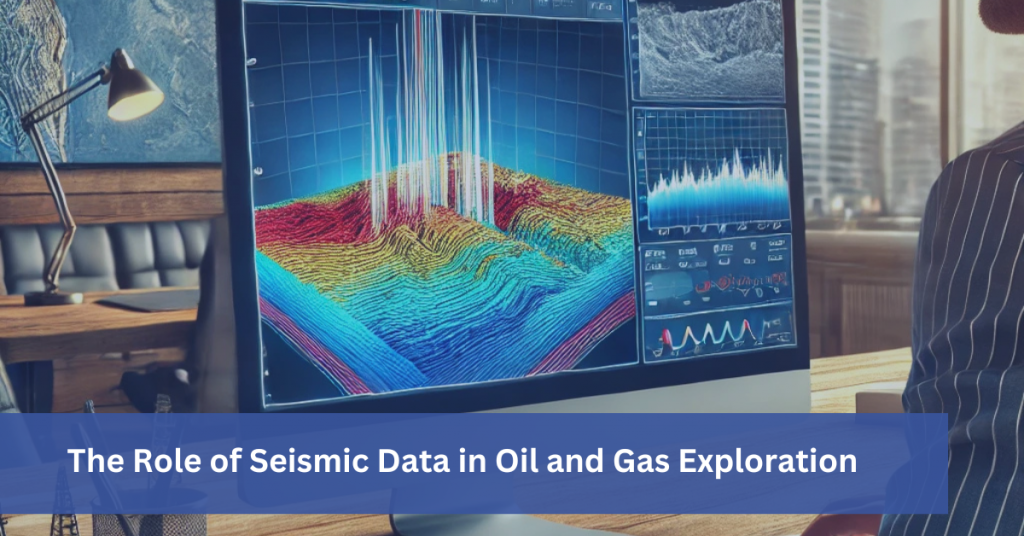
The travel times and amplitudes of those reflections form the raw dataset. After processing, they reveal the depth, thickness, geometry, and physical properties of underground rock formations — producing a subsurface image that guides every major decision in an exploration or development program.
A Brief History: From 2D to 3D Seismic
In the early decades of seismic exploration, 2D seismic surveys were the industry standard. These surveys recorded data along individual lines, producing cross-sectional profiles of the subsurface — useful for broad-scale reconnaissance but limited in their ability to capture the three-dimensional complexity of real geological structures.
As technology and computing power advanced, the industry shifted to 3D seismic acquisition. Rather than recording along a single line, 3D surveys collect data across a grid of receiver and source points, producing a full volumetric image of the subsurface. This allows geophysicists to view the subsurface from any direction, identify structural and stratigraphic features with far greater accuracy, and reduce the risk of drilling into features that 2D data would have missed or misrepresented.
Today, wide-azimuth acquisition and advanced processing techniques have pushed 3D seismic into new levels of precision, particularly in structurally complex settings such as subsalt plays, deep carbonate reservoirs, and tight unconventional formations.
| Era | Technology | Key Limitation / Advantage |
|---|---|---|
| Pre-1980s | 2D Seismic | Single cross-sectional “slices”; useful for regional mapping but prone to misinterpretation of complex structures |
| 1990s–2000s | 3D Seismic | Full volumetric imaging; revolutionized reservoir characterization and reduced dry well rates by up to 50% |
| 2010s | 4D Seismic (Time-Lapse) | Monitors reservoir changes over time; optimizes production and enhances recovery |
| 2020s–Present | 5D, AI-Enhanced, Full-Waveform Inversion (FWI) | Incorporates spatial + temporal + velocity dimensions; automates interpretation and improves resolution in challenging environments |
How 3D Seismic Works: Acquisition, Processing, and Interpretation
A 3D seismic program moves through three distinct phases, each requiring specialized expertise and tools.
Data Acquisition
Seismic waves are generated at defined source points — on land, typically by vibroseis trucks working in a systematic pattern across the survey area. Receivers, or geophones, are deployed in a grid across the surface to capture reflected energy from multiple directions and angles simultaneously. Modern wireless nodal recording systems have largely replaced cabled geophone arrays on land surveys, improving operational efficiency and reducing surface disturbance.
Data Processing
Raw seismic data contains noise, multiples, and other artifacts that must be removed before the signal becomes interpretable. Processing sequences — which may include noise attenuation, velocity analysis, migration, and inversion — transform the raw field recordings into a clean, calibrated 3D volume. Full-waveform inversion (FWI) is an advanced processing technique that builds highly detailed velocity models by iteratively matching synthetic waveforms to recorded data, producing sharper subsurface images in structurally complex areas.
Data Interpretation
Geophysicists and geologists interpret the processed 3D volume, identifying key features such as structural closures, faults, unconformities, and amplitude anomalies that may indicate hydrocarbon presence. Interpretation tools have advanced considerably in recent years — AI-assisted fault extraction and horizon picking have reduced the time required for routine interpretation tasks, allowing interpreters to focus analytical effort on complex features and integration with well data. The result is a detailed geological model that informs well placement, drilling design, and development planning.
The Benefits of 3D Seismic in Oil & Gas Exploration
| Application | What Seismic Data Enables |
|---|---|
| Greater Accuracy | 3D seismic produces a far more detailed and geometrically accurate view of subsurface formations than 2D. This precision reduces the risk of drilling structural or stratigraphic dry holes — particularly in complex geological settings where 2D profiles can be misleading. |
| Enhanced Reservoir Characterization | A comprehensive 3D model allows geoscientists to better understand a reservoir’s geometry, lateral extent, internal heterogeneity, and fluid contacts. This informs decisions about well count, spacing, completion design, and expected recovery. |
| Risk Reduction | Seismic data identifies potential drilling hazards — shallow gas, overpressured zones, unstable formations, and fault-related risks — before they are encountered in the wellbore, allowing operators to plan around them or mitigate them proactively. |
| Improved Well Placement | Accurate structural and stratigraphic mapping from 3D seismic enables precise well placement, particularly in long horizontal laterals where staying within a target formation over thousands of feet depends on reliable subsurface geometry. |
| Development Optimization | By revealing the size, shape, and connectivity of a reservoir, 3D seismic supports more effective field development planning — reducing unnecessary wells, optimizing recovery strategies, and improving the overall economics of a project. |
4D Seismic: Monitoring Reservoirs Over Time
4D seismic — also called time-lapse seismic — involves repeating a 3D survey over the same area at intervals during production. By comparing surveys acquired at different times, geoscientists can detect changes in the reservoir caused by fluid movement, pressure depletion, and injection programs.
These changes manifest as differences in seismic amplitude and travel time between surveys. Areas where water or gas has swept through a previously oil-bearing zone will show measurable seismic differences from the original baseline survey. This information helps reservoir engineers understand how a field is draining, identify bypassed pay zones that weren’t accessed by initial wells, and optimize infill drilling and injection programs.
4D seismic has become a standard reservoir management tool in mature offshore fields and is increasingly applied onshore as well — particularly in fields where enhanced recovery programs make understanding fluid movement essential to production decisions.
Beyond Oil & Gas: CCUS, Geothermal, and More
Seismic methods developed for hydrocarbon exploration have found direct application in several adjacent industries where subsurface knowledge is equally critical.
Carbon Capture, Utilization, and Storage (CCUS)
Seismic data plays a central role in CCUS site evaluation and monitoring. Before injection begins, seismic surveys characterize potential storage formations and assess caprock integrity — confirming that the geology can safely contain injected CO₂. During and after injection, time-lapse seismic monitoring tracks CO₂ plume migration, providing the auditable evidence that regulators and project developers require to demonstrate containment. [Internal link: CCUS geophysical services]
Geothermal Energy
High-resolution seismic surveys are used to map fracture networks and identify permeable zones in geothermal reservoirs — particularly in enhanced geothermal system (EGS) development, where understanding fracture geometry is essential to designing effective heat extraction. Seismic methods that originated in oil and gas exploration are now a standard part of geothermal site characterization.
Mining and Environmental Assessment
Seismic methods are applied to mineral exploration, groundwater characterization, infrastructure siting, and environmental subsurface assessment — any application where detailed knowledge of underground geology is required to reduce decision risk.
How Silverthorne Seismic Puts This Into Practice
Understanding seismic data is one thing. Having the team, the data access, and the project management capability to apply it effectively to a real exploration or development program is another.
Silverthorne Seismic works across the full seismic data lifecycle — from designing and acquiring new 2D and 3D surveys to brokering existing data from our library and through our network, including as an authorized broker for EOG Resources. Our petrophysical team interprets what the data reveals at the formation level, integrating well logs with seismic to support development decisions. Our CCUS practice applies seismic characterization and monitoring methods to carbon storage projects from site identification through post-injection closure.
Whether you are evaluating an area of interest with existing data, planning a targeted acquisition program, or working through the interpretation of a complex formation, our team brings direct, basin-specific experience to every engagement.
Need Existing Data?
Need New Acquisition?
Need Interpretation?
Frequently Asked Questions About Seismic Data in Oil & Gas
Seismic data is subsurface information captured by generating controlled acoustic energy at the surface — typically using vibroseis trucks on land — and recording the reflected waves with sensors called geophones. The travel times and amplitudes of those reflections reveal the depth, thickness, and physical properties of underground rock layers, producing a subsurface image used to guide drilling and development decisions.
2D seismic captures a single cross-sectional profile of the subsurface along a line. 3D seismic acquires data across a grid of source and receiver points, producing a full volumetric subsurface image that can be viewed from any direction. 4D seismic — or time-lapse seismic — repeats a 3D survey over the same area at intervals to detect changes caused by production, injection, or fluid movement in a reservoir.
By imaging subsurface structures before drilling begins, seismic data helps operators identify where hydrocarbons are likely to be trapped, where geological hazards exist, and whether a prospect has the structural and stratigraphic integrity to support a well. This allows for better-informed drilling decisions, more precise well placement, and earlier identification of risks that can be designed around — reducing the likelihood of dry holes, sidetracks, and unexpected downhole events.
Seismic methods are increasingly applied to carbon capture, utilization, and storage (CCUS) — for characterizing CO₂ storage sites, confirming caprock integrity, and monitoring plume migration. Geothermal energy development uses seismic to map fracture networks and identify permeable zones. Mining, environmental subsurface assessment, and groundwater characterization are additional applications.
Timelines depend on survey size, terrain, permitting complexity, and program type. A targeted small patch 3D acquisition — covering roughly 5 to 40 square miles — can deliver a processed data volume in 6 to 8 weeks from mobilization. Regional 3D programs over larger areas require longer acquisition windows and processing timelines. Your acquisition partner should provide a project-specific schedule during the planning phase.
If adequate coverage exists in your area of interest — the right vintage, fold, and orientation for your geological objectives — licensing existing data is almost always faster and more cost-effective than new acquisition. If existing data doesn't meet your resolution requirements, doesn't cover your target area, or is too old to reflect current reservoir conditions, new acquisition may be warranted. A seismic data broker with strong knowledge of what exists in a given area can help you assess your options before committing to either path.
Ready to discuss your seismic data needs?
Contact Silverthorne Seismic to discuss your area of interest, existing data assessment, or acquisition program. Our team responds promptly to all inquiries.
Get In Touch