


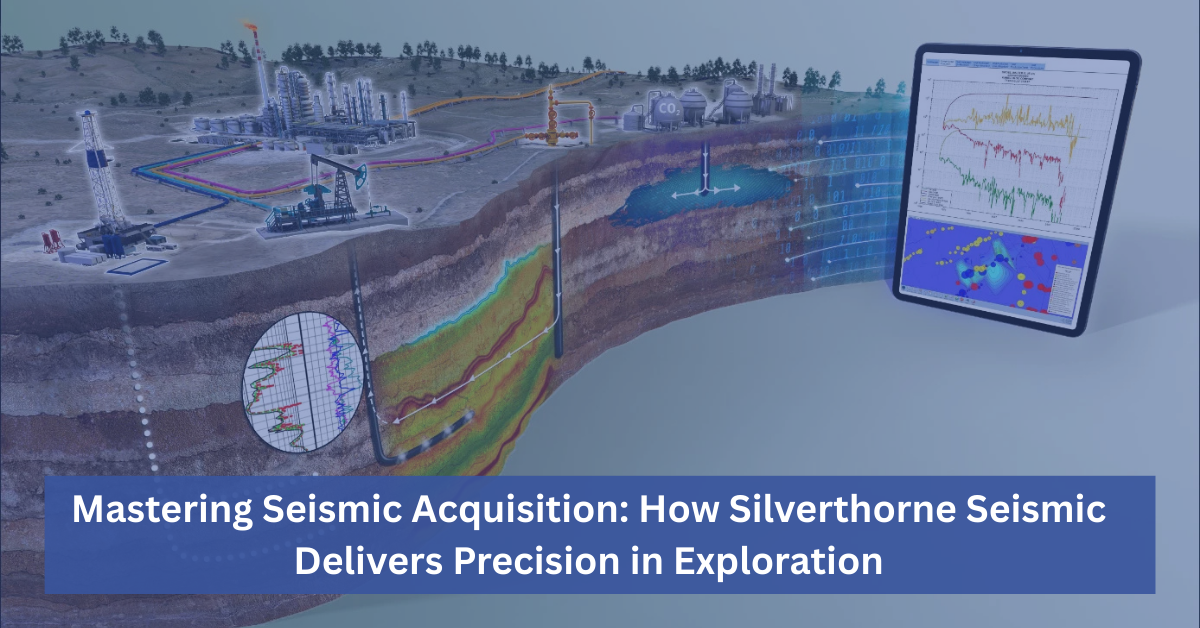


Seismic data is a crucial tool in industries like oil and gas exploration, geology, and even earthquake studies. It provides valuable insights into the Earth’s subsurface, allowing scientists and engineers to create detailed models that help in resource discovery, structural assessments, and environmental protection. However, understanding and interpreting seismic data can seem daunting, especially for beginners. In this guide, we’ll break down the basics of seismic data interpretation to help you get started.
What is Seismic Data?
Before diving into how to interpret seismic data, it’s essential to understand what seismic data is. Seismic data is generated when seismic waves (typically sound waves) are sent into the ground. These waves bounce off different layers of the Earth’s subsurface, and the reflected signals are recorded by sensors called geophones or hydrophones. The collected data helps map the underground formations by highlighting contrasts between materials like rock, gas, oil, and water.
The goal of seismic data interpretation is to make sense of these recorded signals to build an accurate picture of the underground structures.
Steps to Interpret Seismic Data
Interpreting seismic data involves several steps, from understanding the data format to identifying key geological features. Here’s a step-by-step guide for beginners:
1. Understand the Basics of Seismic Waves
Seismic waves can be divided into two main types:
– P-Waves (Primary Waves): These are the fastest seismic waves and travel through both solid and liquid layers of the Earth.
– S-Waves (Secondary Waves): These waves move slower and can only travel through solid material.
When analyzing seismic data, it’s crucial to recognize the types of waves and their behavior as they interact with different subsurface materials. Different wave types provide different information about the underground layers, making it easier to interpret what lies beneath the surface.
2. Learn to Read Seismic Sections
Seismic data is often represented in the form of seismic sections, which are 2D or 3D images showing how seismic waves have traveled through the subsurface. These images typically display the time it takes for seismic waves to travel to a certain depth and bounce back.
Key Elements of Seismic Sections:
– Horizontal Lines: Represent continuous layers of rock or other geological formations.
– Curved or Faulted Lines: Indicate areas where the Earth’s subsurface has shifted or where different types of materials meet.
– Amplitude of Reflections: The strength of the reflected waves provides clues about the type of materials in the subsurface. For example, oil or gas reservoirs may show stronger reflections due to the contrast between gas/oil and rock.
Understanding these patterns and formations in seismic sections is fundamental to interpreting seismic data accurately.
3. Identify Key Geological Features
Once you’ve familiarized yourself with seismic sections, the next step is identifying key geological features. Some common formations to look for include:
– Faults: These are fractures in the Earth’s crust where movement has occurred. They often appear as discontinuities or breaks in the seismic section.
– Anticlines and Synclines: These are upward (anticline) and downward (syncline) folds in rock layers. Anticlines are especially important because they can trap oil and gas beneath them.
– Strata Boundaries: These are the layers of rock, soil, or sediment that show up as continuous horizontal lines on seismic sections. Differences in the layers’ density can indicate the presence of oil, gas, or other valuable materials.
4. Use Time-Depth Conversion
Seismic data is usually recorded in terms of time, meaning it shows how long it takes for seismic waves to return to the surface after reflecting off subsurface structures. However, to understand the depth of these structures, you’ll need to perform a time-depth conversion. This involves converting the time data into actual distances (depth) based on the speed of the seismic waves through the subsurface materials.
Knowing the velocity of seismic waves in different materials helps convert the two-way travel time into accurate depth estimates, allowing for a more precise model of subsurface features.
5. Interpret Amplitude and Frequency
The amplitude (strength) and frequency (rate) of seismic reflections provide clues about the properties of the subsurface materials. Higher amplitude signals often suggest a significant contrast between different layers, such as between solid rock and oil or gas. Lower frequencies might indicate deeper, larger structures, while higher frequencies can reveal finer details of the shallow subsurface.
Understanding how amplitude and frequency changes can guide you in identifying potential resources or hazards within the subsurface.
6. Use Software for Seismic Interpretation
Seismic interpretation has become more accessible thanks to specialized software tools. Programs like Petrel, Kingdom, or SeisImager allow users to visualize seismic data in 2D or 3D, making it easier to identify geological structures. These tools also come with built-in features for time-depth conversion, wave analysis, and the creation of geological models.
Even if you’re just starting out, using seismic interpretation software can significantly speed up your learning process and improve your accuracy.
7. Validate and Cross-Check Your Interpretation
Seismic data interpretation is part science, part art. Once you’ve developed your initial interpretation, it’s essential to validate it by cross-referencing other sources of information, such as well logs, core samples, or geological maps. Validation helps ensure that your seismic interpretation is accurate and aligns with other known data points.
Common Pitfalls to Avoid in Seismic Data Interpretation
As you begin working with seismic data, it’s easy to make mistakes due to the complexity of the process. Here are some common pitfalls to watch out for:
– Over-Interpreting Noise: Seismic data can include “noise” from external sources like machinery, wind, or water. Be careful not to mistake this noise for actual geological features.
– Ignoring Scale: Always consider the scale of your seismic section. Large-scale features may be easier to spot but can make it difficult to identify smaller, yet significant details.
– Misinterpreting Faults and Folds: Not all breaks in the data are faults, and not all curves are folds. Ensure you’re familiar with different geological formations and how they appear in seismic data.
Interpreting seismic data can seem overwhelming at first, but with a clear understanding of seismic waves, seismic sections, and geological features, you’ll be well on your way to mastering this essential skill. Following these steps will help you make sense of the Earth’s subsurface and make informed decisions in exploration or research projects. By using modern seismic interpretation software, validating your findings, and avoiding common pitfalls, even beginners can start interpreting seismic data with confidence.
Seismic data interpretation is a powerful tool that, when done correctly, can lead to significant discoveries, safer infrastructure development, and a deeper understanding of our planet’s structure. Happy interpreting!
Contact Us Today To Learn How We Can Help With Your Seismic needs.